Nuclides and Dry/Wet Deposition: What Does “The Same Fallout” Mean?
At the same ground deposition, dry fallout gives much higher doses than 5-mm wet fallout in these scenarios. But the difference is nuclide-dependent, and even the ranking of nuclides can change.
This example complements seasonality of the deposition date, which varies the calendar date and regional agricultural calendar. Here we hold the date and parameter set fixed and compare I-131, Cs-134, Cs-137 and Sr-90, dry and wet deposition routes, and rainfall depths.
The hypothetical calculations use the packaged valley parameters. The
reproducible script saves detailed run inputs,
per-food doses, checkpoints, refinement results and provenance alongside itself.
1. Design the comparison before interpreting the ratio
All releases occur on 15 July 2001, with an initially 30-year-old adult,
canonical diet and time-activity distribution, Landscape("arable"), and
1,095 elapsed days of follow-up (approximately three years, ending
14 July 2004). No food countermeasures are introduced.
The main cases prescribe 1,000 Bq/m² on the model's ground target:
| Input | Dry-only | Wet-only |
|---|---|---|
| Time-integrated air activity | 2,000,000 Bq s/m³ | 0 Bq s/m³ |
| Wet ground deposition | 0 Bq/m² | 1,000 Bq/m² |
| Rainfall | 0 mm | 5 mm |
Resulting ground target deposition |
1,000 Bq/m² | 1,000 Bq/m² |
All four nuclides are treated as particulate, including I-131. The packaged particulate ground velocity is 0.0005 m/s, so the dry input follows from
Integrated air activity = ground deposition / ground velocity
                        = 1,000 / 0.0005
                        = 2,000,000 Bq s/m³.
This equals about 23.15 Bq/m³ sustained for one day. The script derives the velocity from the dataset rather than hard-coding it. Iodine elemental or organic fractions would change its dry-deposition velocities; these results are specifically for particulate iodine.
The wet-only run isolates the prescribed wet source by setting air input to zero. ECOSYS does not infer washout or rainfall from atmospheric transport. The script also includes a mixed same-cloud case, described below.
Equal ground-target deposition is not equal deposition on every surface
ECOSYS calculates a dry and wet deposit for every surface target:
Dry plant deposit = integrated air × plant velocity × LAI / maximum LAI
Wet plant deposit = wet ground input × interception fraction

Pasture/root-zone source = ground total + dry intensive-grass deposit
Ground-external source  = ground total + dry turf deposit
The two additions above are dry deposits only. These prescribed pathway
sources are not a mass-conserving division of one common ground deposit. A plant
target may receive more activity than the ground target. Wet vegetation
deposition is not added a second time to either source.
| Quantity (Bq/m²) | Dry, all four | Wet I-131 | Wet Cs-134 / Cs-137 | Wet Sr-90 |
|---|---|---|---|---|
| Ground target | 1,000 | 1,000 | 1,000 | 1,000 |
| Intensive-grass target | 2,330.6 | 108.8 | 216.8 | 410.8 |
| Pasture/root-zone source | 3,330.6 | 1,000 | 1,000 | 1,000 |
| Ground-external source | 2,993.3 | 1,000 | 1,000 | 1,000 |
The dry/wet grass-deposition ratios are 21.4 for iodine, 10.7 for caesium, and 5.67 for strontium. This is already a large difference before food transfer or human dose coefficients are applied.
2. Nuclide comparison: three different clocks
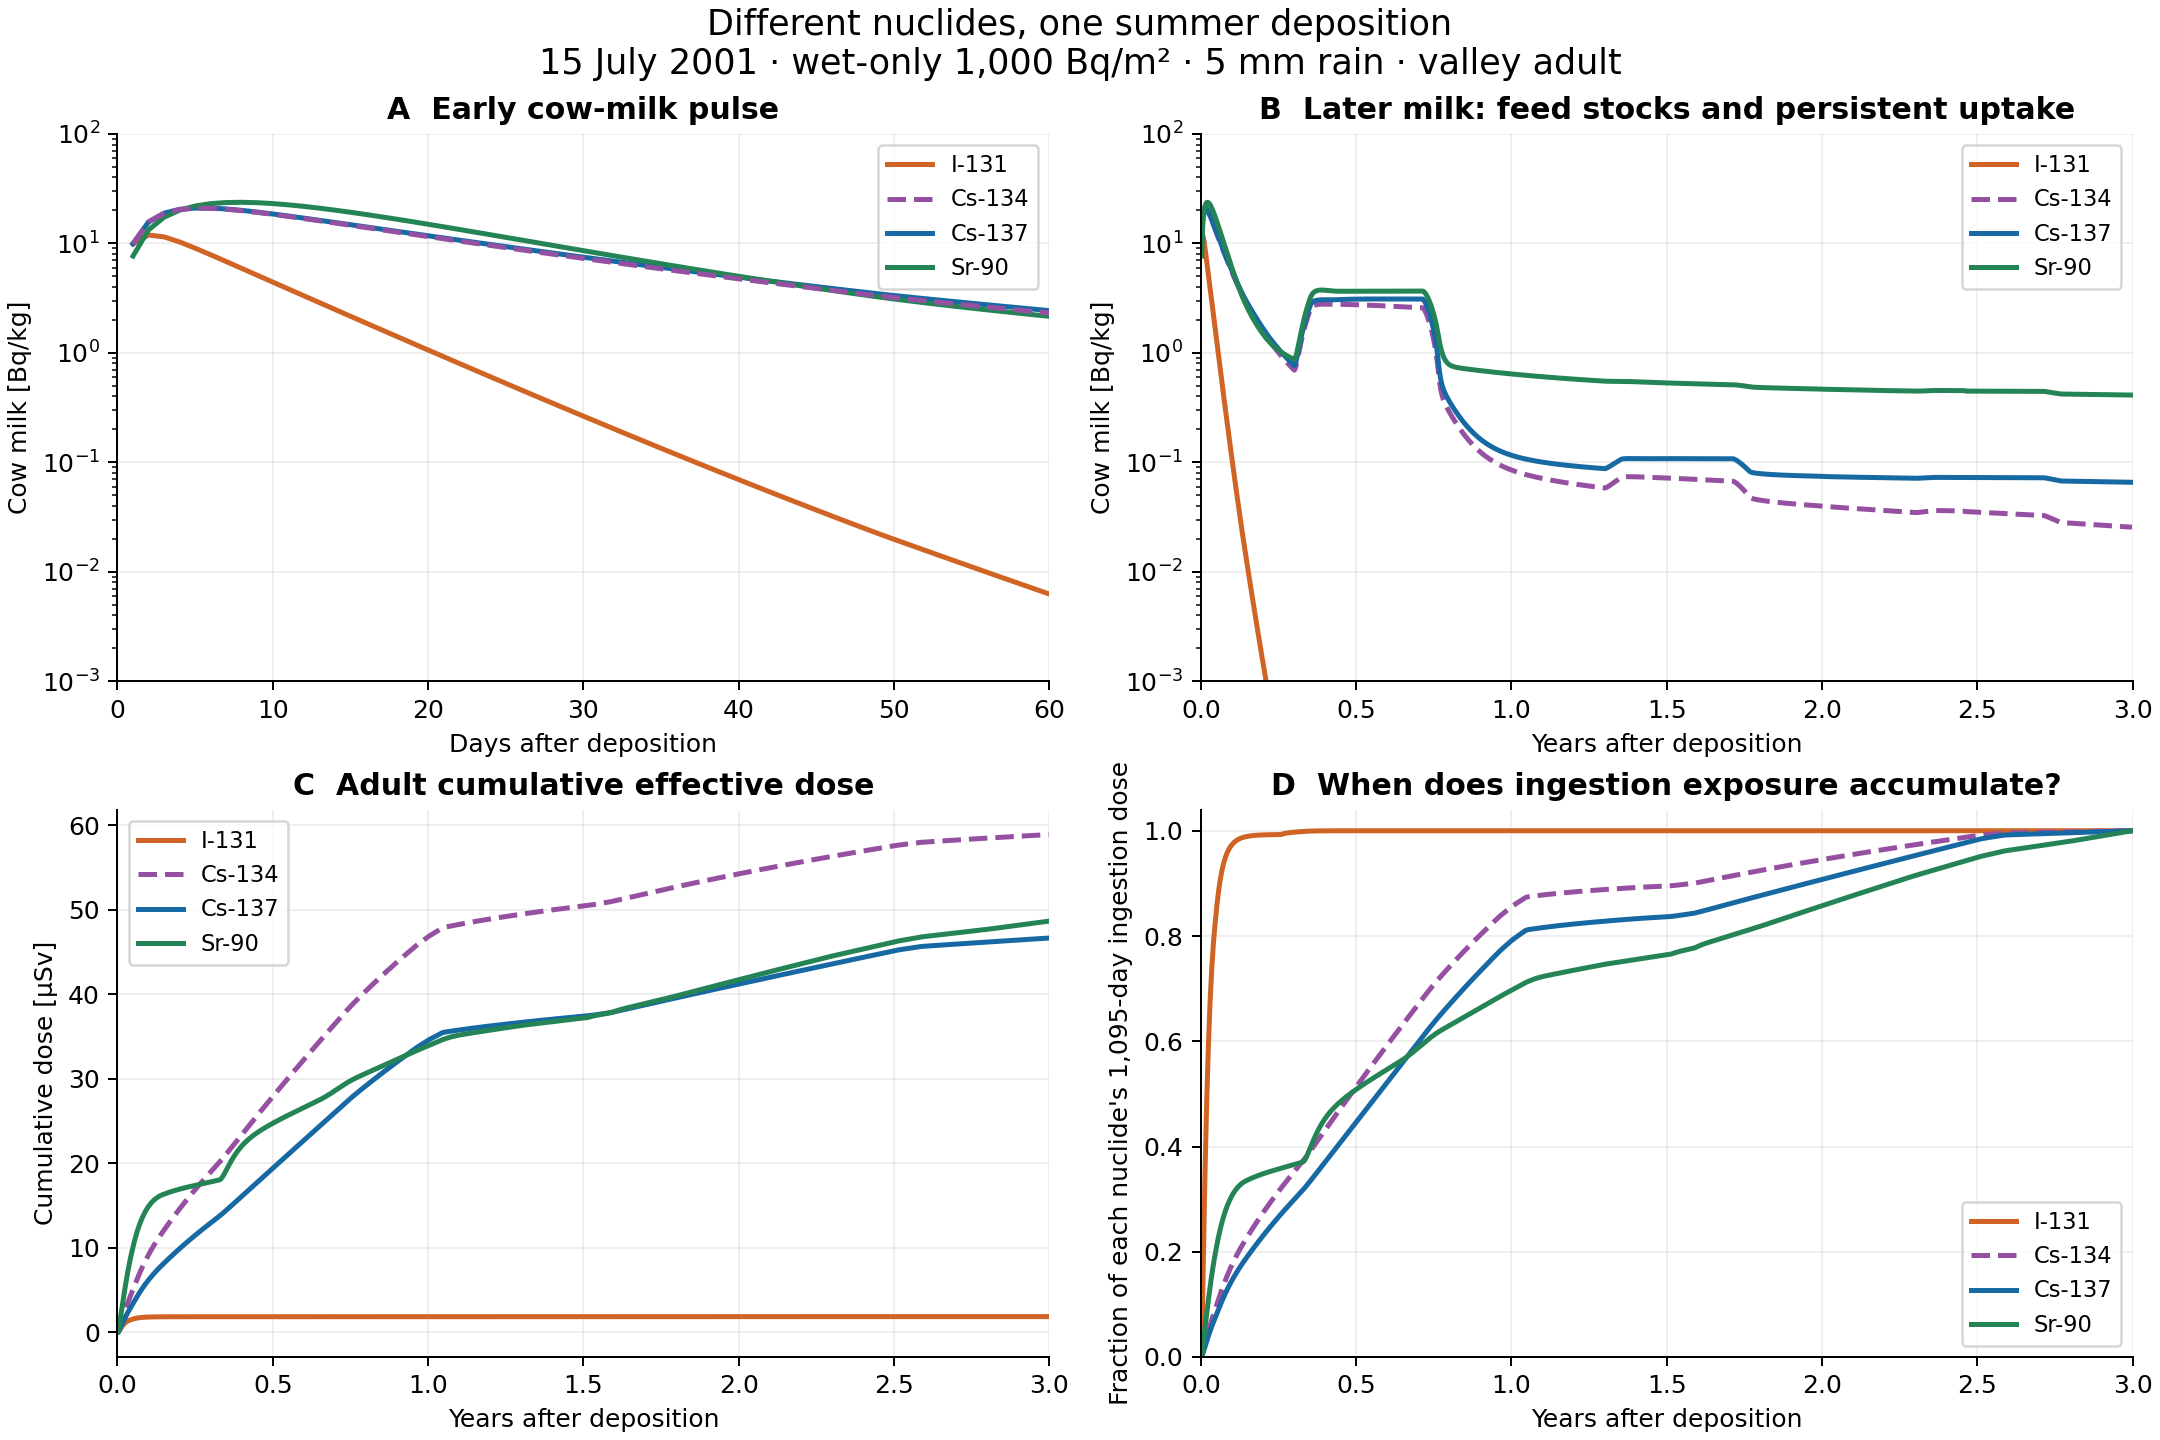
This comparison uses wet-only deposition, 5 mm rain and 1,000 Bq/m² for all nuclides. Cs-134 is dashed so its nearly identical early milk curve can be distinguished from Cs-137. Zeros and very small values are omitted on the logarithmic axes.
| Nuclide | Physical half-life | Peak cow milk (Bq/kg) | Peak day | Milk at day 1,095 (Bq/kg) | Ingestion dose (µSv) | Total dose (µSv) |
|---|---|---|---|---|---|---|
| I-131 | 8.05 days | 11.92 | 2 | effectively zero | 1.785 | 1.836 |
| Cs-134 | 2.06 years | 20.94 | 5 | 0.0255 | 48.89 | 58.90 |
| Cs-137 | 30.1 years | 21.02 | 5 | 0.0657 | 40.83 | 46.65 |
| Sr-90 | 28.5 years | 23.72 | 8 | 0.411 | 48.60 | 48.65 |
Iodine: early exposure dominates
I-131's short physical half-life and 0.7-day milk biological retention produce a fast pulse. 95.4% of its 1,095-day ingestion dose is accumulated by day 30; half is accumulated by day 8. “Accumulated” refers to dose attributed to intakes through that date, not when all committed internal dose is physically delivered.
Fresh foods dominate: leafy vegetables contribute 0.979 µSv, drinking milk 0.598 µSv, together about 88% of ingestion dose. Long-stored foods have little iodine activity left when eaten.
Caesium isotopes: nearly identical early curves, different dose
Cs-134 and Cs-137 share the model's element-specific interception, transfer, processing and retention parameters. Their early milk peaks differ by less than 0.4%. Later, Cs-134 is removed faster by radioactive decay.
The physical-decay-only ratio after 1,095 days is
2^[-1095 × (1/(2.06 × 365.25) - 1/(30.1 × 365.25))] = 0.391.
The final milk ratio is 0.0255 / 0.0657 ≈ 0.389, close to that expectation. The milk calculation also includes retention and the engine's later equilibrium approximation, so this is an explanatory check rather than an exact identity for every product state.
Yet Cs-134 gives more cumulative effective dose: 58.90 versus 46.65 µSv. Its adult ingestion coefficient is 1.9 × 10⁻⁸ Sv/Bq, compared with 1.3 × 10⁻⁸ Sv/Bq for Cs-137. It also gives more ground-external dose: 10.00 versus 5.81 µSv. Over this finite horizon those factors outweigh its faster decay. A concentration ranking is not automatically a dose ranking.
For Cs-137, only 12.5% of three-year ingestion dose occurs in the first 30 days, versus 79.1% by day 365. The slower rise around 1.6–2.5 years includes stored cereals discussed in the seasonality example. The largest individual food contributions are orchard fruit (5.34 µSv), fruiting vegetables (5.11 µSv) and drinking milk (4.05 µSv).
Strontium: stronger persistent soil-to-food transfer
Sr-90 and Cs-137 have similar physical half-lives, but their late milk levels differ: 0.411 versus 0.0657 Bq/kg, about a factor of 6.3. Radioactive survival alone cannot explain this.
The packaged soil-to-intensive-grass factor is 0.5 for Sr versus 0.05 for Cs. Soil kinetics and animal transfer also matter: Sr's cow-milk transfer factor is smaller (0.002 versus 0.003 in the model's contextual day/kg units). The larger persistent soil-derived grass input helps sustain its milk tail. The winter stored-feed rebound occurs for both elements, but later Sr milk remains higher after initial contaminated stocks are replaced.
The adult ingestion coefficient is 2.8 × 10⁻⁸ Sv/Bq for Sr-90. Its main wet-case foods are drinking milk (12.43 µSv), leafy vegetables (12.19 µSv) and rennet cheese (10.75 µSv), together about 73% of ingestion dose. About 30% of its three-year ingestion dose arrives after the first year, compared with 21% for Cs-137 and 14% for Cs-134.
The packaged effective ground-external contribution is zero for Sr-90 in this run. This is the model/coefficient result, not a general claim that beta-contaminated surfaces produce no exposure. Daughter ingrowth is not calculated; Sr-90/Y-90 is not simulated as a coupled environmental chain.
3. Dry versus wet: deposition route changes levels and rankings
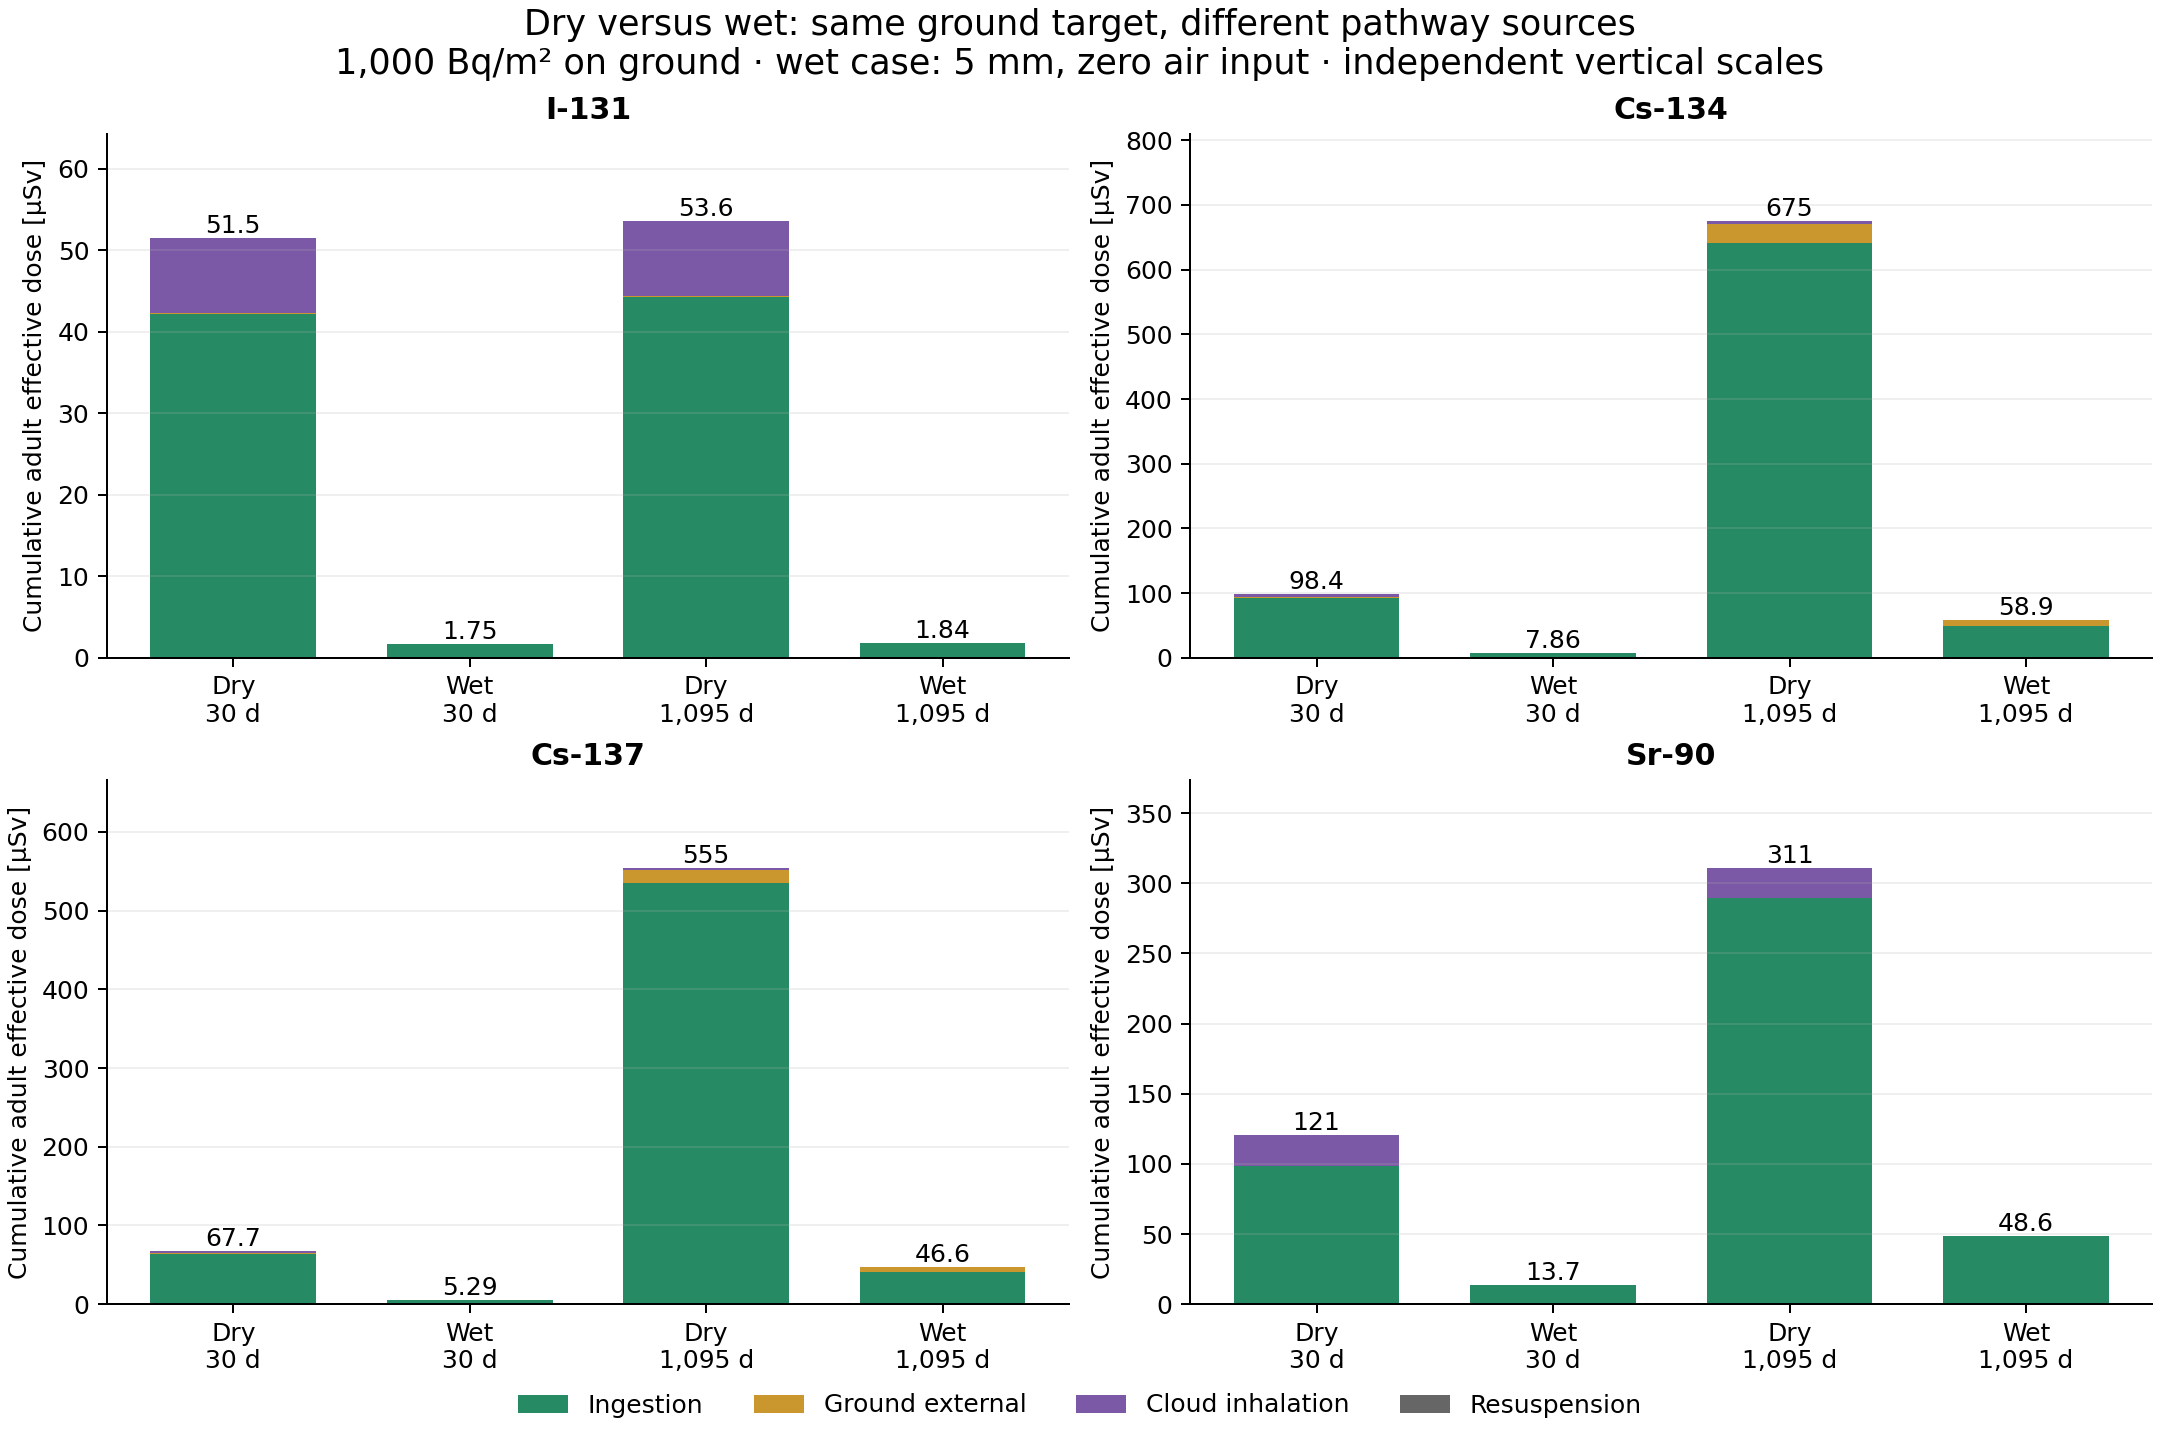
Each panel has its own vertical scale. The dry case includes direct cloud inhalation; wet-only does not. The main difference is nevertheless in ingestion:
| Nuclide | Dry ingestion (µSv) | Wet ingestion (µSv) | Dry total (µSv) | Wet total (µSv) | Dry / wet total |
|---|---|---|---|---|---|
| I-131 | 44.25 | 1.785 | 53.57 | 1.836 | 29.2 |
| Cs-134 | 640.77 | 48.89 | 674.75 | 58.90 | 11.5 |
| Cs-137 | 534.47 | 40.83 | 554.69 | 46.65 | 11.9 |
| Sr-90 | 289.11 | 48.60 | 311.16 | 48.65 | 6.40 |
Several mechanisms contribute:
- Foliage receives different activity. Dry velocities produce substantially higher grass and crop deposits than 5-mm wet interception at the same ground value. Different crops have different dry/wet ratios, so the grass ratio alone does not predict the whole diet.
- The dry soil source is larger. The pasture source is 3.33 times the wet-only source, supporting more later root uptake.
- External irradiation has a different source. For Cs-137, dry ground-external dose is 17.40 µSv versus 5.81 µSv wet: the factor of 2.993 follows the ground-plus-dry-turf convention.
- Dry deposition includes an air-exposure impulse. Cloud inhalation contributes 9.17 µSv for I-131, 4.03 for Cs-134, 2.81 for Cs-137 and 22.0 for Sr-90. Animal inhalation also contributes to dry product histories.
Even excluding cloud inhalation, dry/wet ingestion ratios remain 24.8, 13.1, 13.1 and 5.95, respectively.
The nuclide ranking reverses. Dry Cs-137 has a larger three-year total than dry Sr-90 (555 versus 311 µSv), whereas in the 5-mm wet case Sr-90 slightly exceeds Cs-137 (48.65 versus 46.65 µSv). Wet interception favours Sr more strongly, and its long-lived food pathways matter. There is no route-independent nuclide ranking determined by physical half-life alone.
4. Rainfall depth at fixed wet ground deposition
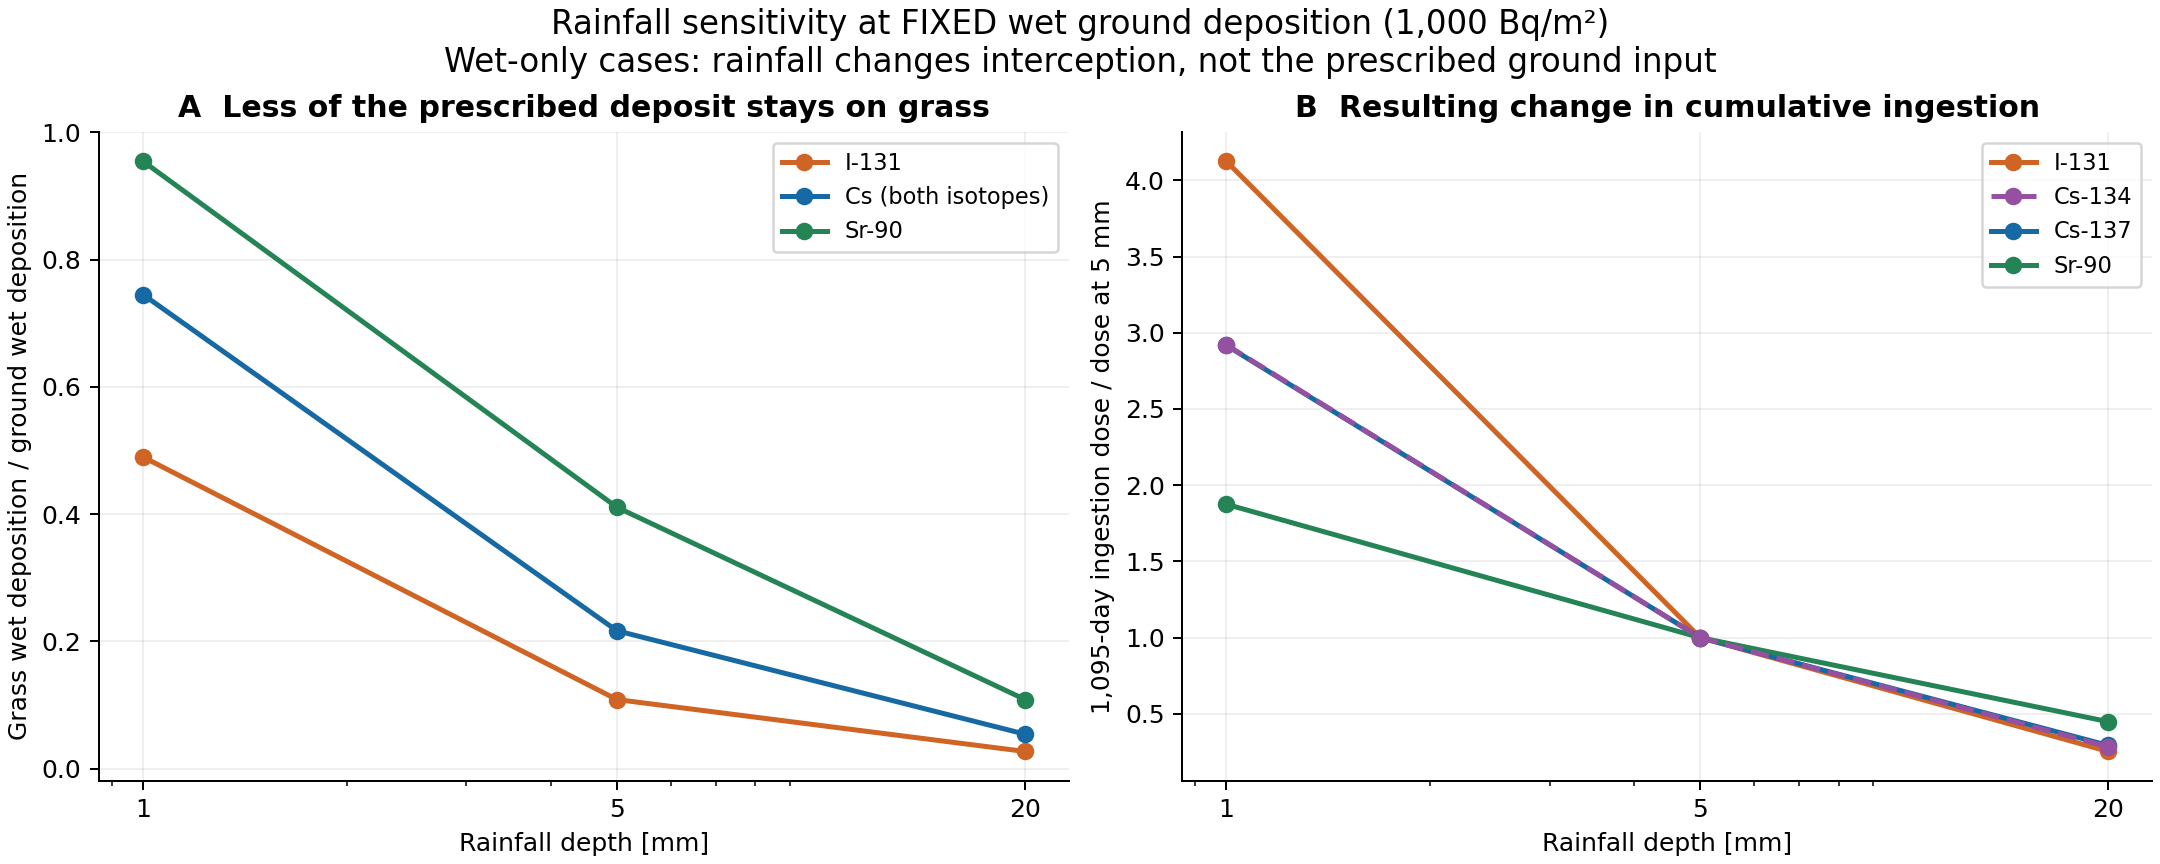
All these cases retain 1,000 Bq/m² wet ground deposition and zero air input; only rainfall changes. The implemented interception fraction is
f = clip[ LAI × S/R × (1 - exp(-ln(2) × R/(3S))), 0, 1 ],
where R is rain depth and S is the element/target water-film parameter. At
sufficiently large R, this approaches LAI × S/R. So increasing rain reduces
the fraction of prescribed wet activity intercepted by the canopy.
For intensive grass, S is 0.1 mm for iodine, 0.2 mm for caesium and 0.4 mm
for strontium. At 5 mm, interception is 10.9%, 21.7% and 41.1%, respectively;
at 20 mm it is 2.72%, 5.44% and 10.9%.
Three-year ingestion dose (µSv):
| Nuclide | 1 mm | 5 mm | 20 mm |
|---|---|---|---|
| I-131 | 7.364 | 1.785 | 0.452 |
| Cs-134 | 142.77 | 48.89 | 13.86 |
| Cs-137 | 119.11 | 40.83 | 11.95 |
| Sr-90 | 91.12 | 48.60 | 21.79 |
Sr-90 is less sensitive in proportional terms: its 20-mm dose remains 45% of the 5-mm value, whereas iodine retains 25% and caesium about 28–29%. The soil source stays fixed at 1,000 Bq/m², so soil-derived food activity persists as foliar interception falls. Another ranking change: Cs-137 exceeds Sr-90 at 1 mm, but Sr-90 exceeds Cs-137 at 5 and 20 mm for ingestion.
This is a comparison at fixed prescribed deposited activity. It does not predict that a real heavier rainstorm necessarily gives less contamination: atmospheric washout that determines ground input is outside ECOSYS.
5. Hold the cloud fixed and add wet fallout
An additional Cs-137 mixed case keeps the dry case's air input and adds 1,000 Bq/m² wet deposition with 5 mm rain:
| Case | Integrated air (Bq s/m³) | Wet input (Bq/m²) | Ground target (Bq/m²) | Total dose (µSv) |
|---|---|---|---|---|
| Dry-only | 2,000,000 | 0 | 1,000 | 554.69 |
| Wet-only | 0 | 1,000 | 1,000 | 46.65 |
| Same cloud plus wet deposition | 2,000,000 | 1,000 | 2,000 | 601.34 |
Adding wet deposition increases dose here by about 8.4%, even though replacing dry deposition with wet deposition at matched ground activity greatly decreases it. What is held fixed determines the interpretation.
Mixed concentrations equal the sum of dry-only and wet-only concentrations to floating-point precision. Final dose is approximately the sum; the maximum trajectory residual is 0.00168 µSv (0.00028% of the mixed final dose). This small residual arises because the logarithmic-mean ingestion quadrature of summed concentration endpoints need not equal the sum of separately integrated doses.
6. Numerical checks and scope
The plotted runs use daily support, 1,096 nodes including day zero. The eight dry/5-mm-wet comparisons were repeated with half-daily support (2,191 nodes). Maximum trajectory differences at common daily nodes, divided by the refined curve peak (or final cumulative dose), were:
| Main cases | Milk | Cumulative ingestion | Cumulative total |
|---|---|---|---|
| I-131, dry and wet | 4.61–4.64% | 1.18–1.35% | 0.97–1.31% |
| Cs-134, dry and wet | 1.67% | 0.39–0.46% | 0.37–0.38% |
| Cs-137, dry and wet | 1.65% | 0.36–0.42% | 0.34–0.37% |
| Sr-90, dry and wet | 1.64% | 0.80–0.83% | 0.74–0.83% |
These are observed refinement differences, not formal error bounds. Peak values are approximate, particularly the sharp iodine peak; the route contrasts are much larger. The 1-mm and 20-mm sensitivity runs use daily support without separate refinement. Script checks cover deposition normalization, pure-route inputs, finite/non-negative series, cumulative dose, pathway and food sums, and mixed concentration additivity.
The late curves include existing model conventions: direct foliar terms end after 730 days, and animal calculations switch to a prescribed equilibrium approximation on 1 January 2004 (day 900). Small late kinks should not be read as independent physical events. The model does not calculate daughter ingrowth.
Here total means ingestion + cloud inhalation + resuspension inhalation + ground external effective dose. Cloud external irradiation is not requested; skin tissue dose is separate. These are per-person cumulative effective doses, including committed effective dose from intake, not organ doses. Equal Bq/m² means equal activity, not equal nuclide mass or release inventory. This is a model comparison under the stated food-supply assumptions, not a measurement-based validation or universal hazard ranking.
Reproduce the example
From the repository root:
python -m pip install -e . "matplotlib>=3.7"
python docs/examples/nuclide-deposition/compare.py
This runs 25 simulations and writes figures (PNG and SVG), results.json,
provenance.json and compressed trajectories.npz alongside the script. To
redraw the figures from those saved results without rerunning ECOSYS:
python docs/examples/nuclide-deposition/compare.py --plots-only
The calculation connects to deposition and interception, plants, hay and feed, animals and dose equations.